ETF Assets Are a Record US$9.35 Trillion and Net Inflows a Record US$660.73 Billion for the Global ETFs Industry at End of First Half 2021
By ETFGI
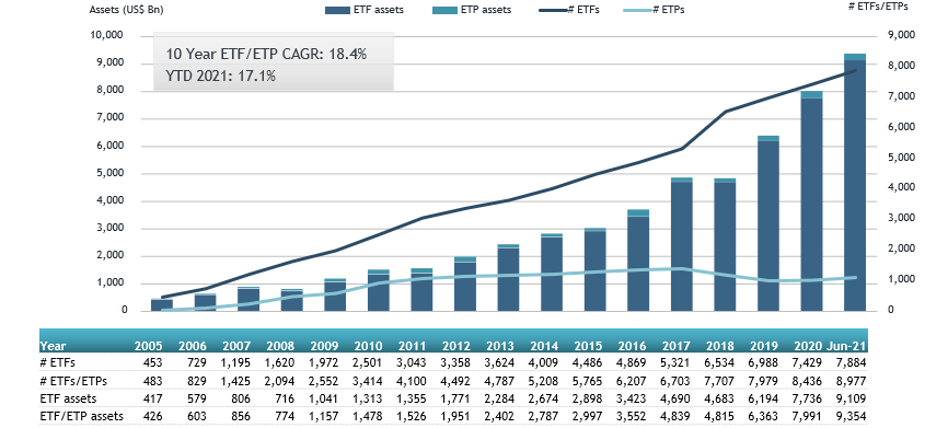
ETFGI, an independent research and consultancy firm covering trends in the global ETFs and ETPs ecosystem, reports that assets invested in ETFs and ETPs listed globally reached a record US$9.35 trillion at the end of the first half of 2021. ETFs and ETPs listed globally gathered net inflows of US$88.50 billion during June, bringing year-to-date net inflows to a record US$660.73 billion which is higher than the prior record of US$293.69 billion gathered at this point last year. US$1.028 trillion in net inflows have been gathered in the past 12 months. Assets invested in the global ETFs/ETPs industry grew by 17% in the first half of 2021 going from US$7.99 trillion at the end of 2020, to US$9.35 trillion at the end of June, according to ETFGI’s June 2021 Global ETFs and ETPs industry landscape insights report, a monthly report which is part of an annual paid-for research subscription service. (All dollar values in USD unless otherwise noted.)
Highlights
-
- Assets in the global ETFs and ETPs industry reached $9.35 trillion at the end of the first half of 2021
- Record YTD net inflows of $660.73 Bn beating the prior record of $293.69 Bn gathered YTD in 2020.
- The $660.73 Bn in net inflows in the first half of 2021 are just $102 Bn less than the $762.77 gathered in all of 2020.
- Equity ETFs and ETPs listed globally gathered a record $460.73 Bn in net inflows in the first half of 2021.
- 25th month of consecutive net inflows
“The S&P 500 gained 2.33% in June and are up 15.25% in the first half of 2021. Developed markets ex-U.S. lost 0.82% in June but are up 9.96% in the first half. Emerging markets are up 0.47% in June and are up 9.03% in the first half,” according to Deborah Fuhr, managing partner, founder and owner of ETFGI.
Global ETF and ETP Assets as of the End of June 2021
 Source: ETFGI
Source: ETFGI data sourced from ETF/ETP sponsors, exchanges, regulatory filings, Thomson Reuters/Lipper, Bloomberg, publicly available sources and data generated in-house. Note: This report is based on the most recent data available at the time of publication. Asset and flow data may change slightly as additional data becomes available.
The Global ETFs and ETPs industry had 8,977 products, with 18,299 listings, assets of $9.354 trillion, from 556 providers listed on 77 exchanges in 62 countries at the end of the first half of 2021.
During June, ETFs/ETPs gathered net inflows of $88.50 Bn. Equity ETFs/ETPs listed globally gathered net inflows of $63.34 Bn in June, bringing net inflows for 2021 to $460.73 Bn, much greater than the $89.28 Bn in net inflows at this point in 2020. Fixed Income ETFs/ETPs listed globally reported net inflows of $18.32 Bn during June, bringing net inflows for 2021 to $111.67 Bn, higher than the $105.09 Bn in net inflows fixed income products had attracted YTD in 2020. Commodity ETFs/ETPs listed globally suffered net outflows of $1.31 Bn, bringing net outflows for 2021 to $4.90 Bn, significantly lower than the $54.20 Bn in net inflows commodity products had attracted at this point in 2020. Active ETFs/ETPs reported $8.06 Bn in net inflows, bringing net inflows for 2021 to $82.23 Bn, which is much higher than the $26.06 Bn in net inflows active products attracted YTD in 2020.
Substantial inflows can be attributed to the top 20 ETFs by net new assets, which collectively gathered $41.14 Bn during June. The Invesco QQQ Trust (QQQ US) gathered $6.16 Bn the largest net inflows.
Top 20 ETFs by net new inflows June 2021: Global
Name Ticker Assets (US$ Mn) June-21 NNA (US$ Mn) YTD-21 NNA (US$ Mn) June-21 Invesco QQQ Trust QQQ US 174,723.42 5,836.05 6,160.63 SPDR S&P 500 ETF Trust SPY US 376,588.32 -1,981.23 4884.88 Vanguard Total Stock Market ETF VTI US 250,652.50 20,360.11 3,506.53 Vanguard Total Bond Market ETF BND US 78,563.87 12,397.36 2,898.78 Vanguard S&P 500 ETF VOO US 232,656.20 26,717.31 2,538.63 iShares 20+ Year Treasury Bond ETF TLT US 15,469.30 -2,030.56 2,440.54 iShares U.S. Real Estate ETF IYR US 7,026.67 816.38 2,258.53 iShares Core S&P 500 ETF IVV US 282,861.11 12,749.70 1,597.28 iShares Core MSCI EAFE ETF IEFA US 95,780.72 5,359.11 1,533.56 iShares MSCI Eurozone ETF EZU US 8,070.13 2,516.45 1,519.30 Vanguard FTSE Developed Markets ETF VEA US 100,924.56 5,857.54 1,396.71 iShares Core MSCI World UCITS ETF – Acc IWDA LN 38,397.32 5,404.79 1,359.06 Vanguard Value ETF VTV US 81,704.88 10,234.10 1,245.16 SPDR Portfolio S&P 500 Growth ETF SPYG US 12,378.48 1,405.25 1,221.76 Vanguard FTSE Europe ETF VGK US 19,663.01 3,707.61 1,211.64 iShares Short-Term Corporate Bond ETF IGSB US 26,693.36 4,521.11 1,163.76 Vanguard Total International Stock Index Fund ETF VXUS US 48,163.44 6,302.15 1,159.00 Schwab US Dividend Equity ETF SCHD US 26,038.71 6,554.07 1,117.53 iShares Core MSCI Emerging Markets ETF IEMG US 83,678.15 9,227.95 969.11 SPDR Blackstone/GSO Senior Loan ETF SRLN US 6,295.18 3,996.78 959.91 Source: ETFGI data sourced from ETF/ETP sponsors, exchanges, regulatory filings, Thomson Reuters/Lipper, Bloomberg, publicly available sources and data generated in-house. Note: This report is based on the most recent data available at the time of publication. Asset and flow data may change slightly as additional data becomes available.
The top 10 ETPs by net new assets collectively gathered $1.37 Bn over June. The iShares Gold Trust (IAU US) gathered $262 Mn the largest net inflows.
Top 10 ETPs by Net New Inflows June 2021: Global
Name Ticker Assets (US$ Mn) June-21 NNA (US$ Mn) YTD-21 NNA (US$ Mn) June-21 iShares Gold Trust IAU US 28,611.36 -1,043.42 262.04 ProShares Ultra VIX Short-Term Futures UVXY US 835.29 1,193.40 212.24 Xtrackers IE Physical Gold ETC Securities – EUR Hdg Acc XGDE GY 872.47 765.63 184.34 SPDR Gold Shares GLD US 58,222.02 -6,864.85 172.7 WisdomTree Precious Metals – EUR Daily Hedged – Acc 00XQ GY 135.72 13.96 134.28 Xtrackers IE Physical Gold ETC Securities – Acc XGDU LN 1,881.84 1,649.25 91.98 Credit Suisse Silver Shares Covered Call ETN SLVO US 261.61 226.69 90.92 AMUNDI PHYSICAL GOLD ETC (C) – Acc GOLD FP 3,640.50 620.83 79.78 iPath Series B S&P 500 VIX Short-Term Futures ETN VXX US 998.15 973.82 69.98 Xetra Gold EUR – Acc 4GLD GY 13,245.36 949.36 68.19 Source: ETFGI data sourced from ETF/ETP sponsors, exchanges, regulatory filings, Thomson Reuters/Lipper, Bloomberg, publicly available sources and data generated in-house. Note: This report is based on the most recent data available at the time of publication. Asset and flow data may change slightly as additional data becomes available.
Investors have tended to invest in Equity ETFs/ETPs during June and in the first half of 2021.
Contact [email protected] if you have any questions or comments on the press release or ETFGI events, research or consulting services.
Source: Read Full Article